


I know that, on the outside, I can seem like a personable, amicable, young (looking) professional with an abundance of optimism.
That is mostly true, but it is also a somewhat carefully crafted persona that allows me to build relationships relatively quickly with just about anyone. In reality, there’s a part of me buried inside that is deeply jaded. I can trace it back to many things, but I can trace a significant portion back to one specific day early in my professional safety career.
As an emerging private-sector safety professional, I learned a lot about the recurring frustrations in the safety profession very quickly. I was part of a small safety team working in construction for a contractor who was experiencing explosive growth. At a glance, everything was in place that we needed to be successful, both as a team and as an organization. We had the knowledge, skills, and experience on our team to excel, the means and budget to implement appropriate safe practice, and the support from operations leaders to execute our mission.
However, explosivity brings many challenges. The organization nearly tripled in size within our first year as a safety team. We had new workers, temporary workers, challenges with maintaining robust communications, and many inconsistencies in requirements from site owners and general contractors. Most importantly, workers were experiencing injuries.
It felt like something went wrong nearly every day. In that first year alone, I remember a crushed limb, a lost eye, multiple encounters with federal and state compliance officers, and an abundance of minor strains, sprains, and lacerations. This is the time period when I learned both the fallacies and deep rootedness of traditional approaches to safety (i.e. assignment of blame). This is when I had plenty of experience trying to force deeper root cause investigations. This is also when I became intimately familiar with the process of case management and how, when done properly, it serves the employer better than it serves the worker. As a team, we were exhausted after that first year or so, and there seemed to be no end in sight.
One day, I walked back into the main office to finish my shift. We usually informally met as a safety team near the end of the day to debrief, gripe, and moan. However, the air in the office was different on this day. It was electric, positive, and somewhat celebratory. As I was walking to meet with the safety team, one of the older project managers stopped me. He said, “did you hear? Our EMR went down? Great work!”
Sidebar: if you are unfamiliar, EMR stands for experience modification rate. On their website, FFVA Mutual Insurance Co. describes EMR as a critical metric for both workplace safety performance and workers’ compensation insurance. Basically, it is the dollar amount of a company’s actual incurred losses, based on workers’ compensation claims, divided by the expected losses based on the industry average. The rating directly affects premiums, but FFVA also states that it can affect reputation, competitiveness, and employee morale and retention.
So, I smiled and nodded at the project manager, went into the safety office, and noticed the entire team was sharing my own expression. Were we happy? No. We were exhausted. We were frustrated. We knew something was off. Quantifiably, the EMR was sound and legitimate. There is no doubt about that. We knew, however, that things were not working. We knew that workers were not safe. We had that watermelon dashboard thing going on.
Did we all just suck, or were we looking at the wrong metric?
We need to talk about SIF
Let’s keep this brief because, chances are, you have heard about this problem already. If not, you might be living under a rock. In fact, we might be neighbors. I only recently learned the magical capabilities of using the slide master view in Microsoft PowerPoint.
Over the last few decades, the safety profession has become quite…proficient…at managing a metric known as total recordable incident rate (TRIR).
Figure 2. Occupational Injury and Fatality Trends in the United States
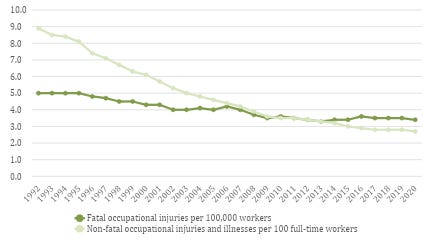
Note. Adapted from “Injuries, Illnesses, and Fatalities: Census of Fatal Occupational Injuries (CFOI) – Current,” by BLS, December 16, 2021. https://www.bls.gov/iif/oshcfoi1.htm#rates
Chances are that you’ve already seen a chart like this before. Sexy right? Figure 2 is a version of a chart that is commonly used to emphasize that, over the last few decades, we have indeed drastically lowered non-fatal injury rates in the United States. However, in that same time period, we have only slightly reduced fatal injury rates.
There are two things I want to emphasize here:
First, we do have a problem. Based on this data, it is apparent that we, as a profession, have become very good at reducing the risk associated with non-fatal, recordable injuries. However, workers are still dying on the job at nearly the same rate that they were 30 years ago. That is a big issue, and it has sparked a movement within our profession to change metrics and systems to more effectively address serious injuries and fatalities (SIF). It is an absolutely admirable and essential movement because the worst thing that we can do is continue to let workers be exposed to hazards that could potentially threaten, alter, or end their lives.
But if you ask why this chart looks the way it does, the answer can be much more complex. Have we truly reduced the risk associated with recordable injuries? Are we controlling hazards better now than we used to? Are we simply better at managing the number? How does the “science” of case management affect non-fatal injury rates? Are there issues still with reporting, where non-fatal injuries are easier to cover up than fatalities? Are these rates truly reflective of reality?
This brings me to my second point of emphasis: there are significant flaws with the way this data is presented. The first one should be more obvious than it is. If you look closely at the details, non-fatal injury rates and fatal injury rates are calculated differently. Fatal occupational injury rates are calculated by the number of fatalities per 100,000 workers. Non-fatal occupational injury and illness rates are calculated by the number of injuries peer 100 full time workers. This is a great way to normalize or standardize data points and produce a digestible number for both rates, but, in theory, they should not exist on the same Y-axes such as what has been illustrated in the many versions of this chart over the past few years.
But it sure is sexy when presented at a conference to motivate safety professionals to pay more attention to SIF prevention. For that, I cannot fault the intent.
Then, of course, we need to talk about the glaring issues that are inherent to TRIR…